This function performs Monte Carlo simulations to estimate the main metrics (bias, variance, and RMSE) characterizing the small (finite) sample behavior of an estimator. The function evaluates the metrics as a function of a single parameter, keeping the other ones constant. See Details.
Arguments
- D
A subclass of
Distribution. The distribution family of interest.- est
character. The estimator of interest. Can be a vector.
- df
data.frame. a data.frame with columns named "Row", "Col", "Parameter", "Estimator", and "Value".
- prm
A list containing three elements (name, pos, val). See Details.
- obs
numeric. The size of each sample. Can be a vector.
- sam
numeric. The number of Monte Carlo samples used to estimate the metrics.
- seed
numeric. Passed to
set.seed()for reproducibility.- bar
logical. Should a progress bar be printed?
- ...
extra arguments.
Details
The distribution D is used to specify an initial distribution. The list
prm contains details concerning a single parameter that is allowed to
change values. The quantity of interest is evaluated as a function of this
parameter.
The prm list includes two elements named "name" and "val". The first one
specifies the parameter that changes, and the second one is a numeric vector
holding the values it takes.
In case the parameter of interest is a vector, a third element named "pos"
can be specified to indicate the exact parameter that changes. In the example
shown below, the evaluation will be performed for the Dirichlet distributions
with shape parameters (0.5, 1), (0.6, 1), ..., (2, 1). Notice that the
initial shape parameter value (1) is not utilized in the function.
Examples
# \donttest{
# -----------------------------------------------------
# Beta Distribution Example
# -----------------------------------------------------
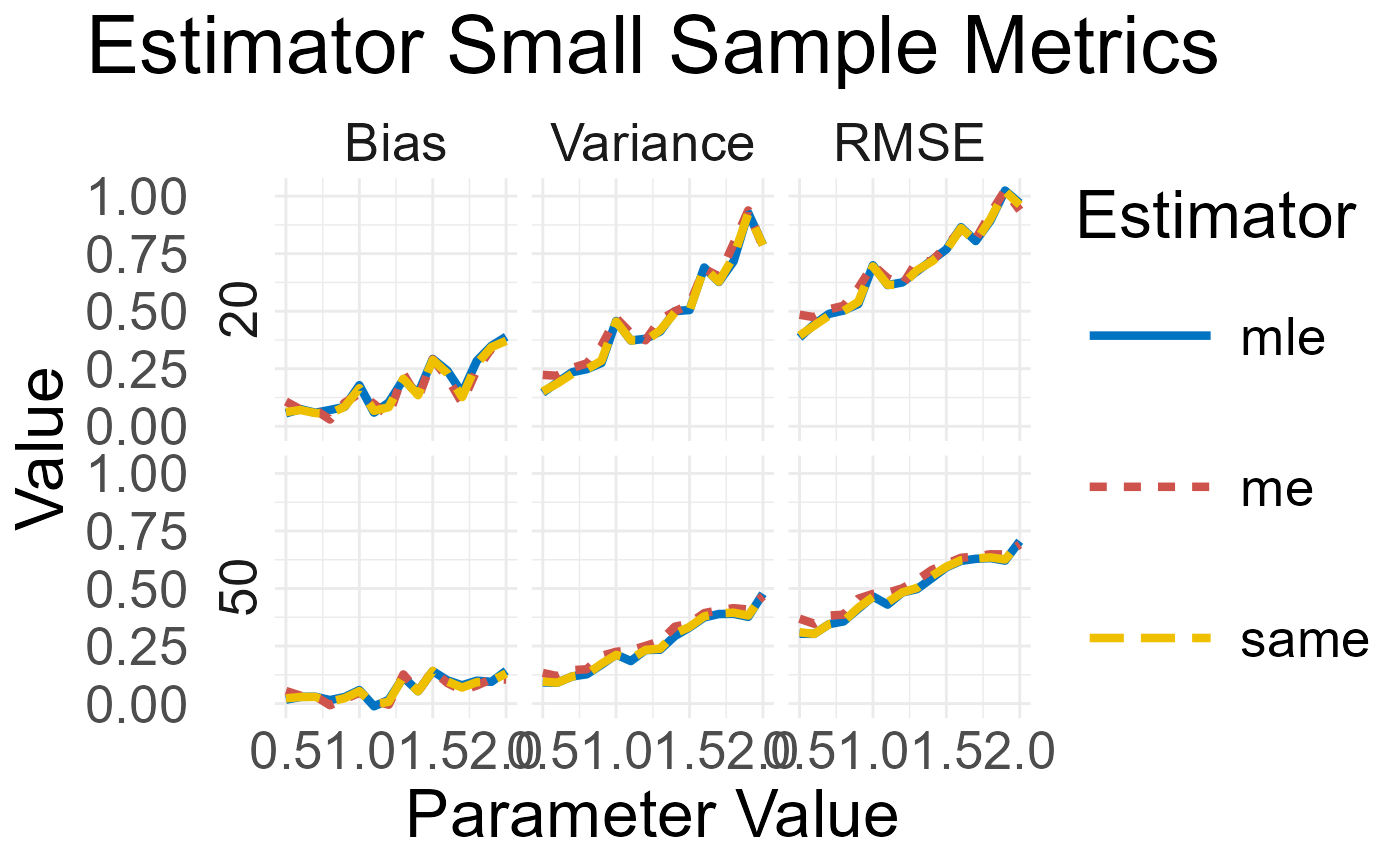
D <- Beta(shape1 = 1, shape2 = 2)
prm <- list(name = "shape1",
val = seq(0.5, 2, by = 0.1))
x <- small_metrics(D, prm,
est = c("mle", "me", "same"),
obs = c(20, 50),
sam = 1e2,
seed = 1)
plot(x)
 # -----------------------------------------------------
# Dirichlet Distribution Example
# -----------------------------------------------------
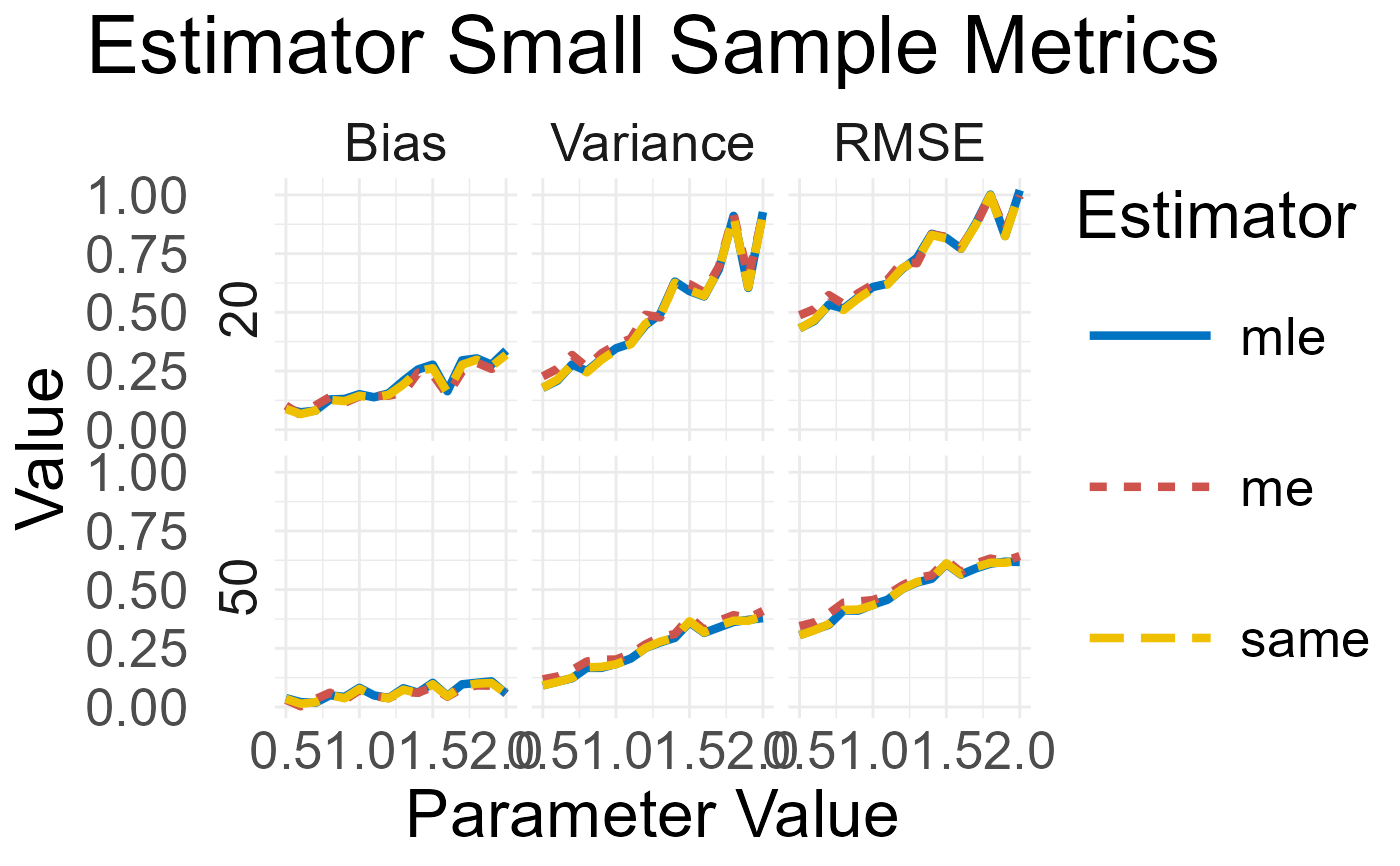
D <- Dir(alpha = 1:2)
prm <- list(name = "alpha",
pos = 1,
val = seq(0.5, 2, by = 0.1))
x <- small_metrics(D, prm,
est = c("mle", "me", "same"),
obs = c(20, 50),
sam = 1e2,
seed = 1)
plot(x)
# -----------------------------------------------------
# Dirichlet Distribution Example
# -----------------------------------------------------
D <- Dir(alpha = 1:2)
prm <- list(name = "alpha",
pos = 1,
val = seq(0.5, 2, by = 0.1))
x <- small_metrics(D, prm,
est = c("mle", "me", "same"),
obs = c(20, 50),
sam = 1e2,
seed = 1)
plot(x)
 # }
# }